Draft deadlines are a necessary but sometimes unfortunate book editing reality. Naturally, some content doesnt make the cut because the proverbial chalk line has to snap somewhere. So it was with the second edition of The Risk Business.
However, this Substack is now officially The Risk Business addendum.
The Current State of Cyber Risk Representation
Ask any risk professional about calculating and visually representing risk, and youll likely receive an answer invoking the likelihood x impact equation. Obviously, the rigor applied to defining terms such as likelihood and impact and calculating their respective values is necessary to establish credibility and trustworthiness in their use. But! Even well-researched and calculated values for these labels fail to capture the required nuance in cybersecurity controls and residual risk.
Thus, the first edition of The Risk Business focused on quantifying risk for a more precise conversation focused on specific financial losses. The rub is that most executives dont have the time to drill into models and build confidence in model results. If, as a security industry, we must rely on qualitative expressions of risk to further executive comprehension, then lets use the best verbiage.
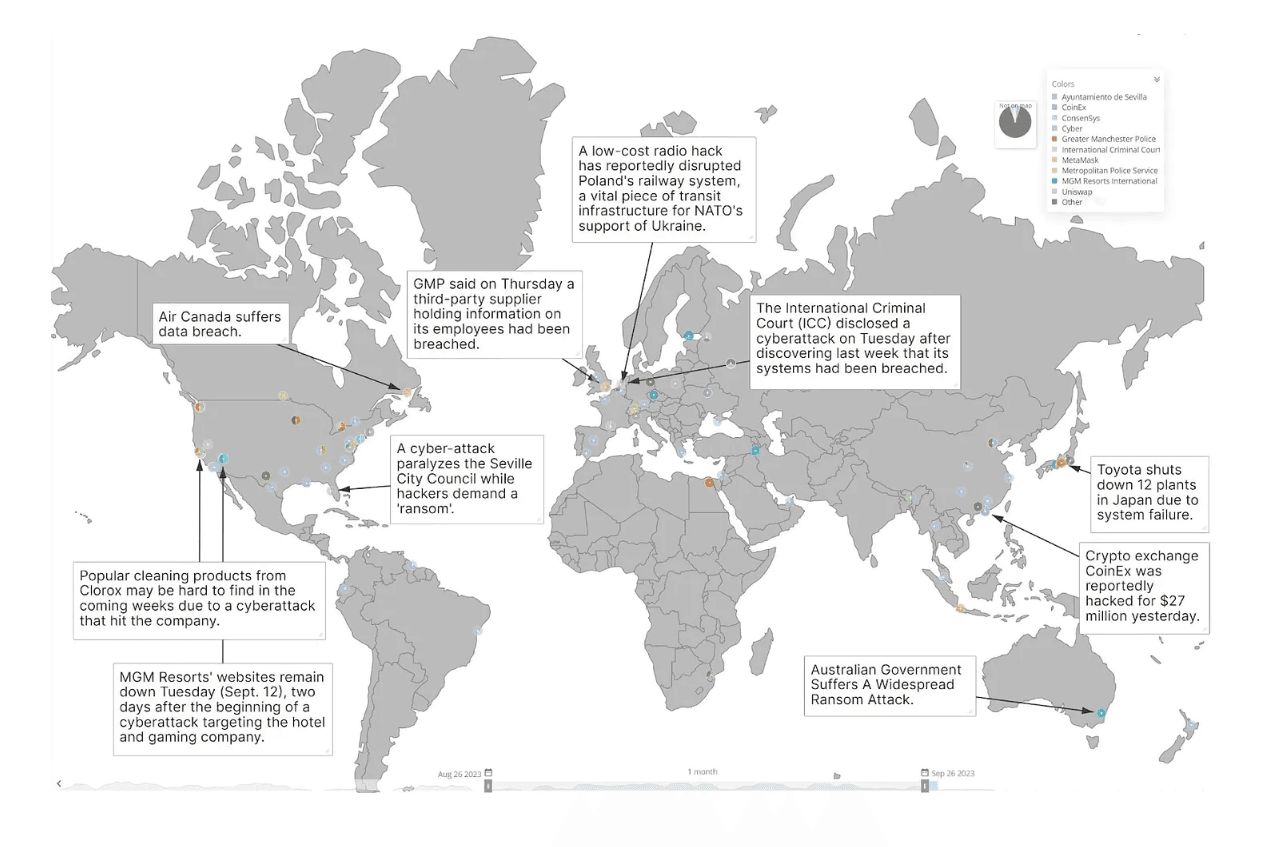
Daily headlines (see above, courtesy of Recorded Future) are a reminder that organizations are largely failing to manage cyber risk. Why? One primary reason (not the only reason, of course) is that using likelihood and impact at the business executive level, specifically for cyber risk, has caused continuous failures of understanding and associated action. The current likelihood x impact risk graph is ineffective.
A Shift in Cyber Risk Communication
Adjacent to the traditional risk graph, and as previously mentioned, informed CISOs (Chief Information Security Officers) are moving away from traffic light signals and subjective risk matrix labels (how much sleep should a CEO lose over a green or low designation that moves to amber or medium?) to binary risk assessments (yes or no) and tabletop exercises for improved executive clarity and communication.
Many CISOs are still forced to participate in legacy Enterprise Risk Management (ERM) risk registers and matrices where cyber might occupy one or two rows in a sea of over fifty high-level business risks (a soup of geopolitical, regulatory, physical, financial, climate, etc.). Its no mystery why business executives and boards of directors (BODs) are disconnected from the details that matter in cyber risk.
A New Paradigm for Cyber Risk
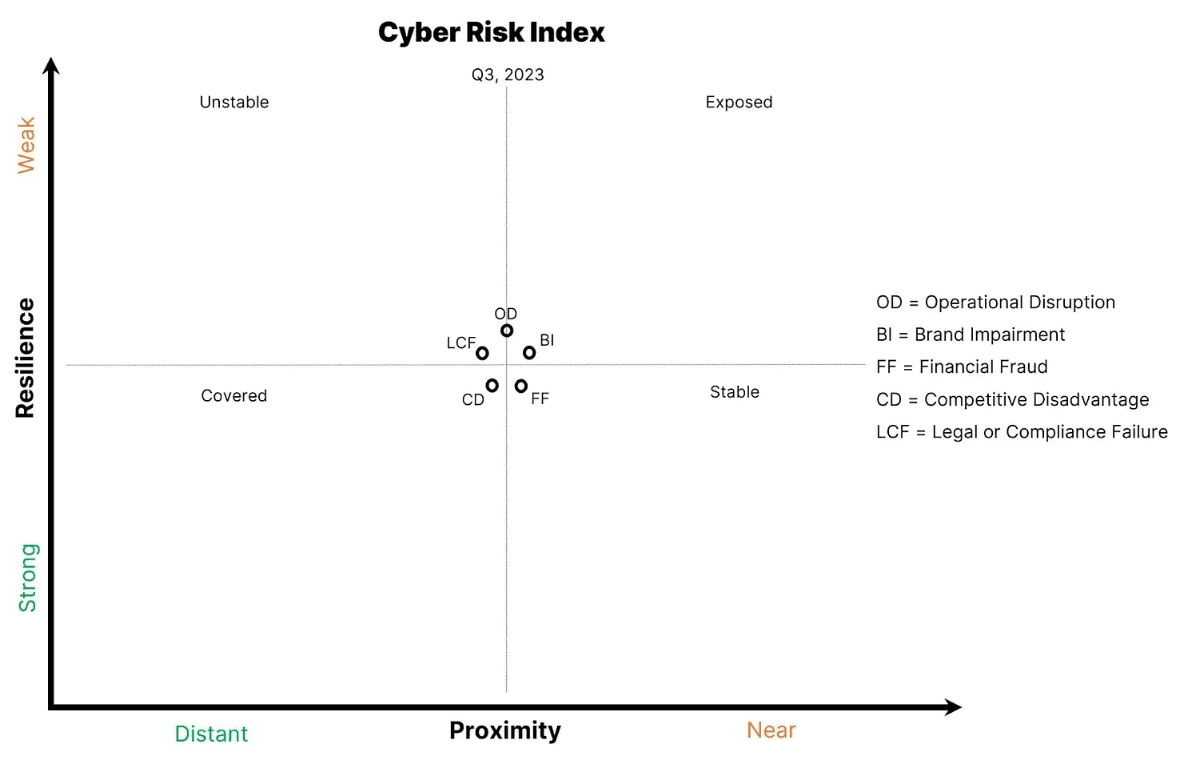
A different paradigm is needed to effectively communicate risk. After participating in many CISO conversations, I think theres an improved construct for business executives that explicitly uses the five cyber risk impacts. The graph below is meant to replace the existing cyber risk graph and associated matrices. The intended goals in this design for executives and BODs are to improve:
- risk comprehension and engagement
- confidence in cyber security investment timing (present/future)
- security teams perceived value
The Y-Axis: Resilience
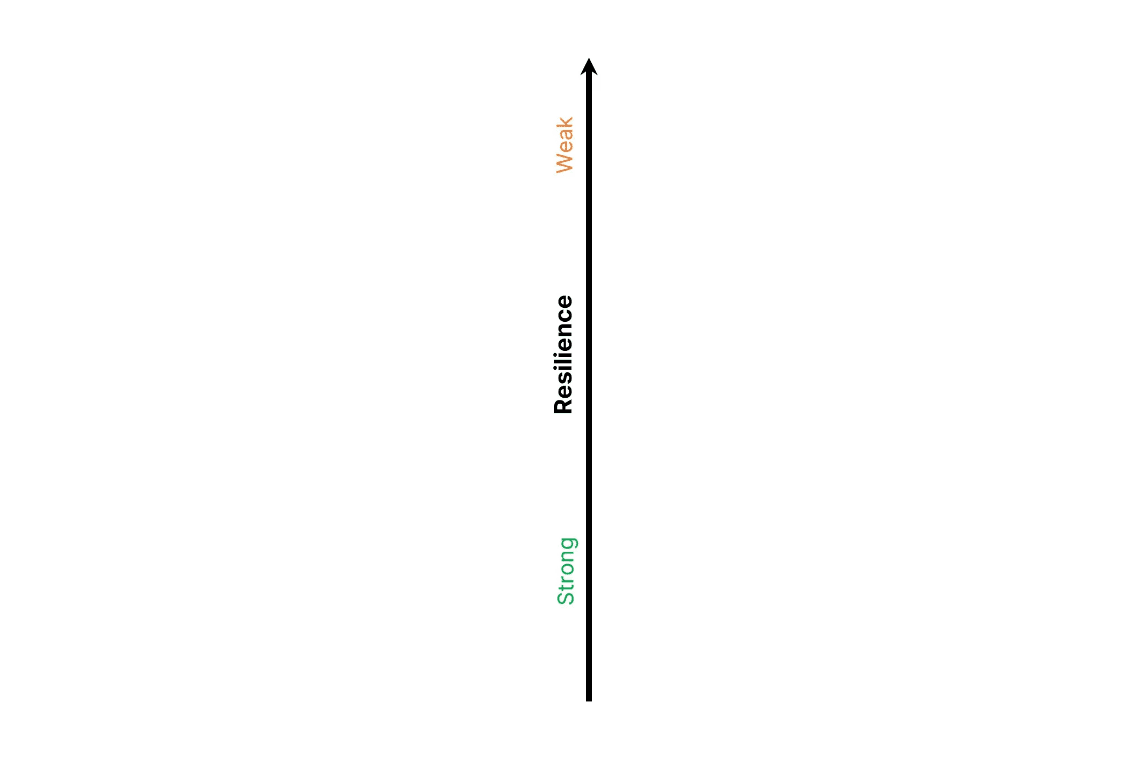
Lets begin with the axes. The Y-axis is labeled Resilience not only because its the word of the year in cyber circles, but also because its a beautifully efficient term for communicating an organizations total controls (process, technical, financial, etc.). I recently participated in the Financial Times Cyber Resilience Summit. In addition to the repeated use of Resilience in conversation, one session provided explicit evidence that the word is helpful for executives, particularly CEOs.
Michael Smets from the University of Oxfords Sad Business School related that when he attempted to interview CEOs about cyber, they demurred and offered an audience with the organizations CISO. After multiple failed attempts, Michael began requesting interviews on resilience. CEOs accepted. Michael believes a lack of confidence in cyber security knowledge leads many CEOs to disengage, when of course, just the opposite is necessary.
Resilience is a non-threatening label for executives. They can dip their toe in the water because resilience extends to all corners of an enterprise. Cyber is just one important pillar in a much larger resilience structure.
The additional benefit of using resilience is an appreciation for work that might otherwise go unnoticed. The range of resilience improvement activities exceeds GRC (Governance, Risk, and Compliance) control checklists. For example, enhancing the gamification of phishing training might improve employee engagement, leading to improved resilience around social engineering attempts beyond email. Similarly, running a proper ransomware tabletop exercise may not be reflected in a completed control list that assists in passing a certification audit. Rather, the threat scenario exposes new gaps in people, processes, and technology and demonstrates unrecognized risk directly to all involved. Resilience increases (becomes stronger) due to the tabletop exercise, and increases again when the gaps are addressed (does it really take two days to restore critical systems from cold backups?).
Likelihood and impact are both focused on negative events. Resilience adds much-needed comparative positive context around an organization's efforts to combat cyber risk.
The X-Axis: Proximity
Next, the X-axis uses Proximity (as in Attack Proximity) to capture the totality of threats with an organizational nexus. Telemetry is shorthand for all the security and threat data that requires consideration when mapping this axis. Internal security telemetry, external threat telemetry, and public cyber events are all critical for articulating proximity.
For example, a healthcare company observes other healthcare companies victimized by ransomware attacks. As a result, attack proximity moves to the right. Another example is a steel manufacturing companys security operations center (SOC), which notices increased phishing attempts. That internal telemetry signal would move proximity to the right as well.

Quadrants, Time, and Graph Movement
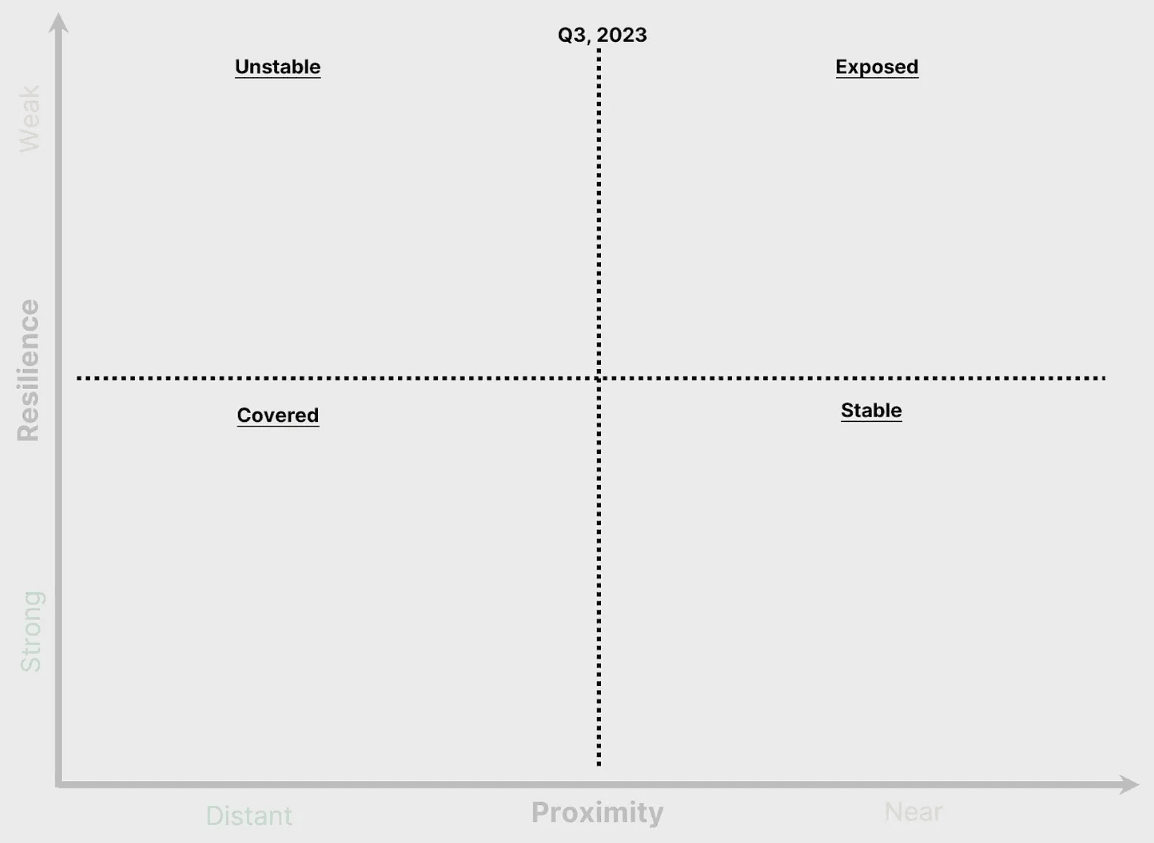
Cyber attacks move fast, and the volume of global cyber attacks in any given day, (or any given hour) is challenging to comprehend. The graph midlines help visualize movement, and the top label is the absolute reference to anchor time increments. The amount of movement (1 klick equivalent) is flexible, as are the midline labels. Ideally, the time segment chosen is large enough to highlight movement. If a CISO maintains a quarterly or bi-annual BOD audience, the start of a quarter or half-year date is an optimal label.
The quadrant labels - Unstable, Stable, Exposed, and Covered - are flexible. Avoiding fear, uncertainty, and doubt (FUD) in messaging is crucial, so if different labels are desired, aim for simplicity and expressiveness. The danger with labels is that an audience reduces the messaging to a quadrant. For that reason, quadrant labels should only be included when helpful. Experiment liberally and measure the efficacy of engagement and comprehension.
Threat Categories to Risk Impacts
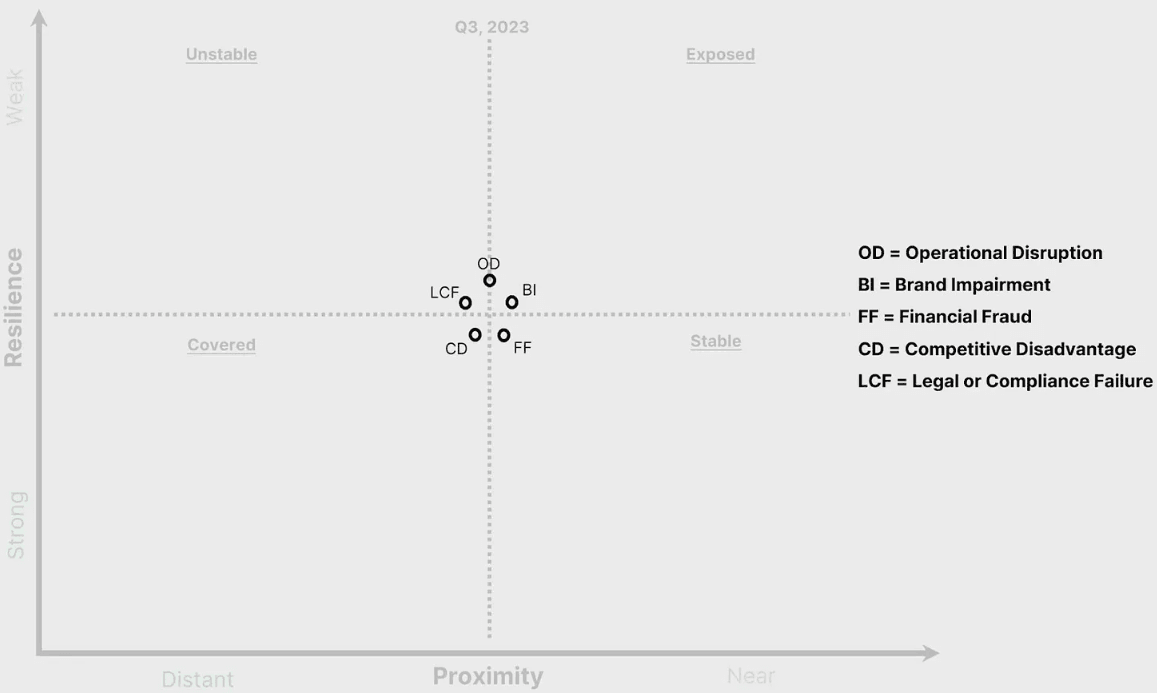
The five data points - representing each risk impact - are the final ingredient in this graph. In the above examples, I used threats and attacks as examples, but telemetry and controls must be translated into business language for maximum consumption and impact.
Thus, a ransomware tabletop exercise would move the Operational Disruption risk impact data point south on the Y-axis because resilience specifically improved for that specific risk impact.
On the X-Axis, threat categories fuel risk impact movement, and the translation is the critical componentsome threat categories map to multiple risk impacts. For example, business email compromise (BEC) primarily creates a Financial Fraud risk impact but might also trigger Brand Impairment if the event becomes public. The mapping is generally intuitive; where a threat categorys risk impact is ambiguous, dont let perfect become the enemy of good.
Examples
Lets translate a few security scenarios into the cyber risk graph! The following are all based on proven attacks, and my solution bias skews toward intelligence because intelligence is a significant security control accelerator and risk mitigation.
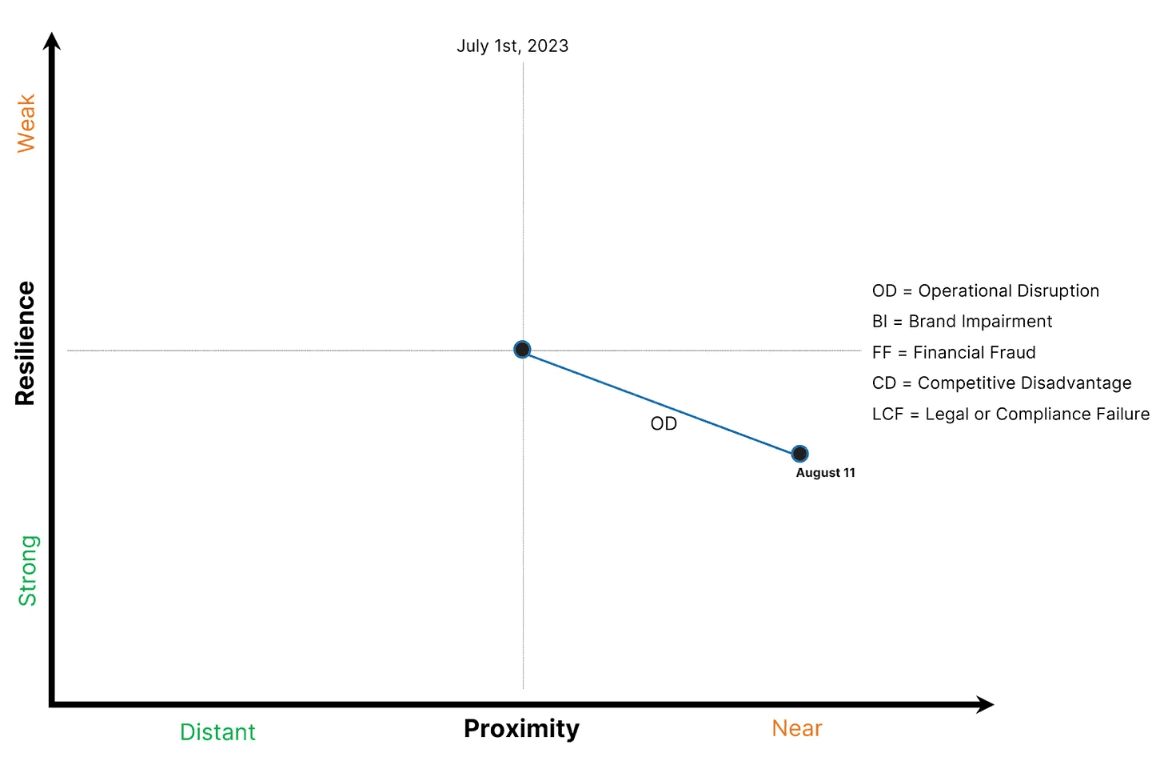
1.) A large bank sustains a heavy distributed denial of service (DDoS - an attacker sends more data than the recipient or the recipients internet circuits can handle, resulting in online services becoming unavailable) attack that crashes the banks website for four hours. The bank quickly re-routes its IP address space to a third-party DDoS mitigation service (with a massive amount of bandwidth), which subsequently renders the DDoS attack ineffective, and the banks website is once again available and functioning properly.
The banks security team compiles the technical DDoS attack details for an internal report, and (perhaps more importantly) moves the Operational Disruption data point in the cyber risk graph to reflect both an increase in attack proximity (an actual attack is, of course, 100% proximity) and an increase in resilience due to the addition of the outsourced DDoS mitigation service.
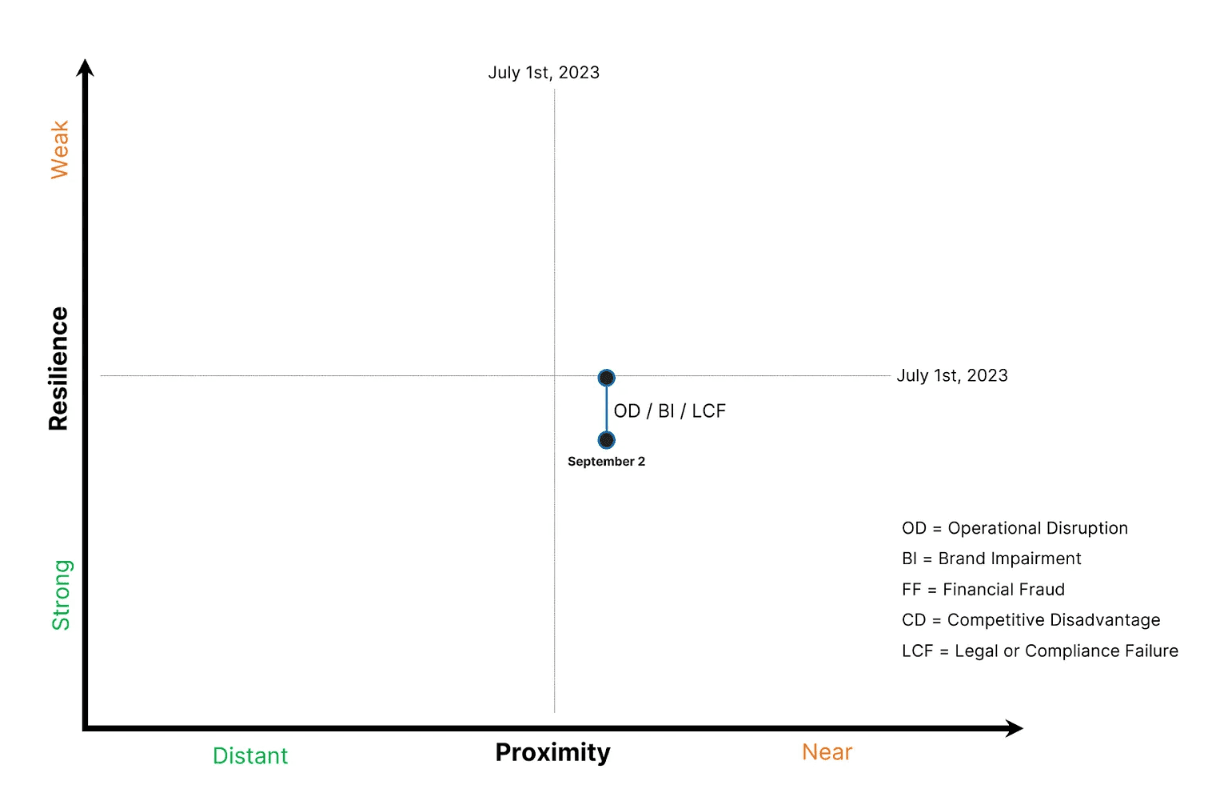
2.) After multiple years of mergers and acquisition (M&A) activity, the security team for a large retailer is still grappling with effective IT infrastructure and data asset inventory mapping. Fast-moving digitalization projects have further expanded this retailers digital footprint. The CISO obtains Attack Surface Intelligence (ASI), which immediately alerts on previously hidden IT infrastructure containing dangerous software vulnerabilities ripe for exploitation.
The attack proximity for vulnerabilities (particularly those that enable remote code execution (RCE)) is constant, regardless of industry. The volume of malicious opportunists scanning the internet never ceases to amaze. However, this retailers resilience has improved through the addition of ASI. In this example, an exploited vulnerability could lead to multiple realized threats, from ransomware to cryptocurrency miners to stolen personally identifiable information (PII), so theres equal opportunity for movement among the associated risk impacts. In this case, the retailers security team moves multiple risk impacts south to account for improved resilience against Operational Disruption, Brand Impairment, and Legal or Compliance Failure.
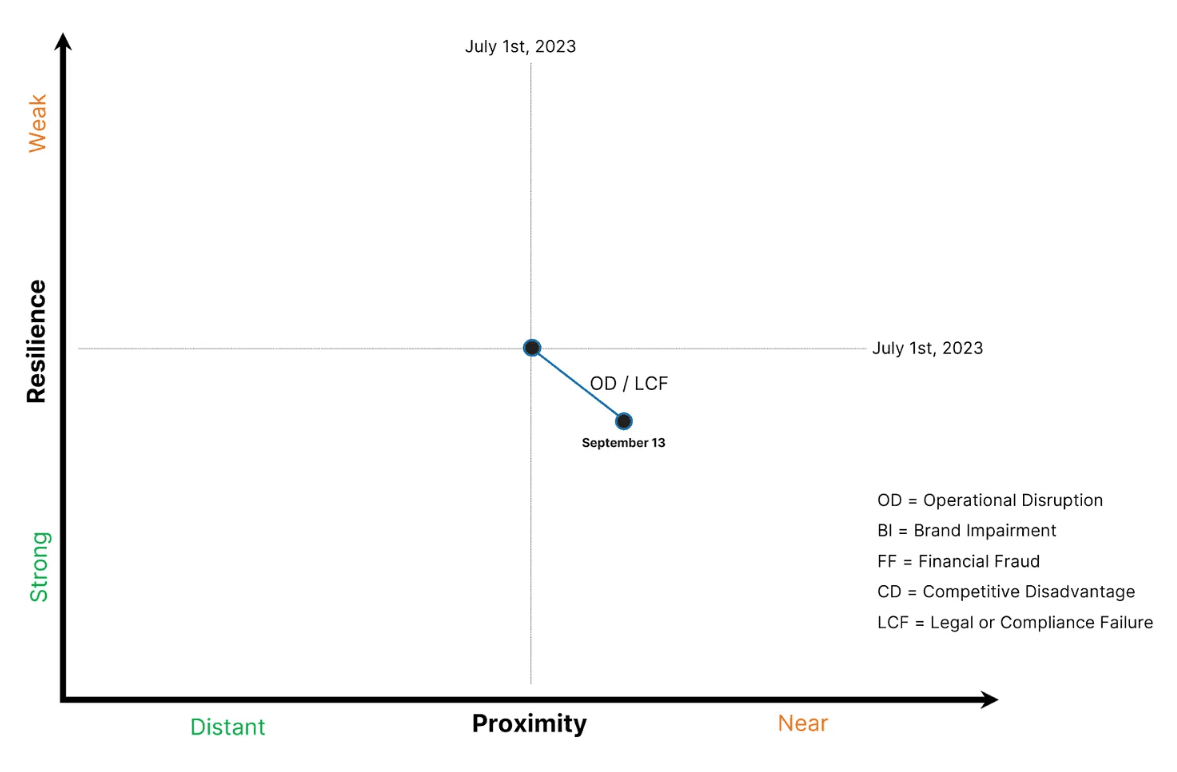
3.) The security team at a large airline recognizes multiple competitors in the travel industry being victimized by ransomware attacks. The actors use stolen credentials obtained from initial access brokers (IAB) databases to gain unauthorized access before stealing terabytes of data from customer databases and encrypting production servers.
The CISO moves quickly to procure Identity Intelligence and integrates it with his Okta multi-factor authentication (MFA) solution. Stolen employee credentials (typically obtained from infostealer malware on employee laptops) are immediately flagged and remediated through Okta automated workflows.
In this example, the Operational Disruption and Legal or Compliance Failure risk impacts are moving down and to the right as attack proximity moves closer and resilience improves.
4.) A semiconductor manufacturer is alerted to a competitors supply chain compromise from a foreign third-party firmware manufacturer. The firmware compromise wasnt discovered for eighteen months, leading to the large-scale theft of intellectual property (IP) from various multinational enterprises. The semiconductor manufacturer evaluates third-party intelligence solutions to quickly identify tier-one vendors and suppliers with malware beaconing to command and control (C2) servers.
Here, the Competitive Disadvantage risk impact moves laterally until the security team secures a proven third-party intelligence solution, which will then move the risk impact vertically.

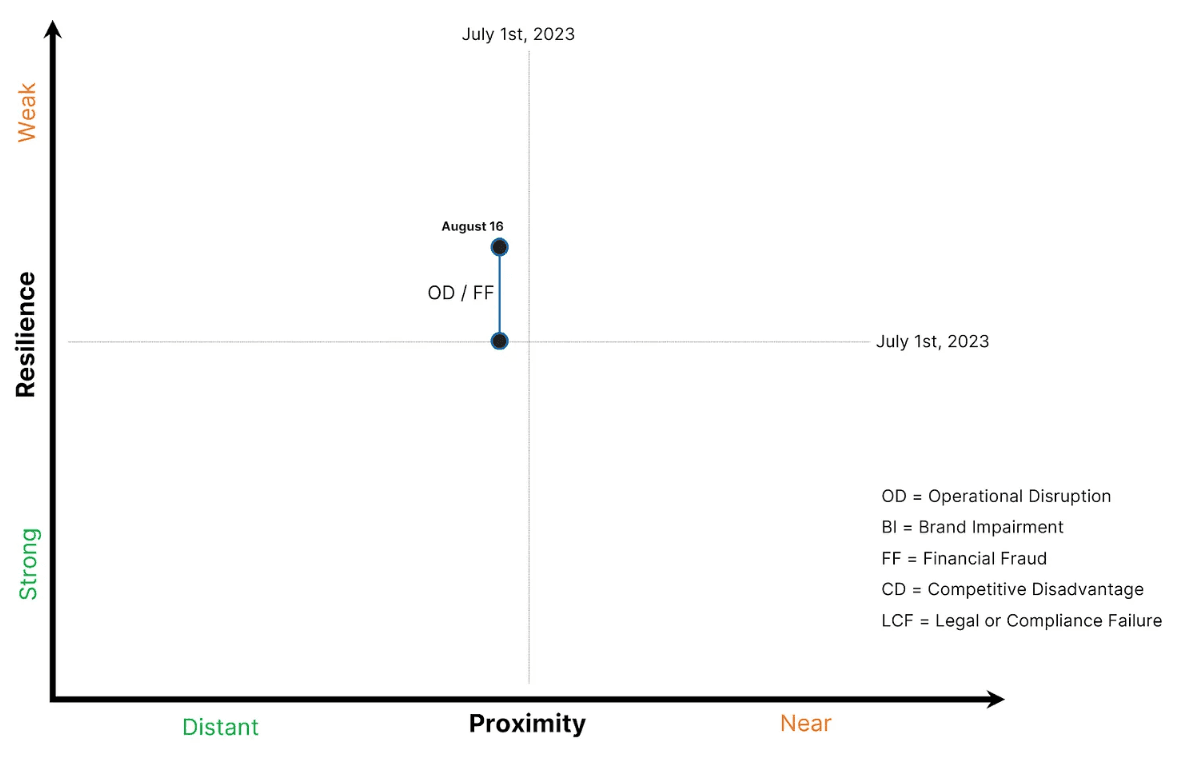
5.) The CEO of a global electronics manufacturer is focused on understanding the tradeoffs between Generative AIs promise of productivity acceleration and a potential loss of IP privacy. Meanwhile, the companys Red Team creates AI-generated offensive cyber scenarios for the CISO to better identify emerging security control gaps. The team successfully executes multiple attack scenarios that extend beyond improved social engineering efficacy.
In this example, multiple risk impacts (Operational Disruption and Financial Fraud to begin) likely move North until security controls can be created or improved to account for the new AI attack variables.
The Complete Graph
The power of this graph captures movement with verbiage that executives understand. Ideally, an executive or board member asks, Why did that risk impact move? Thats the opportunity to pull the thread, enable and create confidence in the answer, and future action. Proximity and Resilience arent perfect. They are still subjective and open to interpretation, but when operating in a qualitative storytelling environment, they are an improvement over likelihood and impact.
The risk community is generally happy with the status quo. The intelligence, cyber security, and risk communities must do better. Lets build a beautiful community where security professionals and business executives communicate clearly, understand each other, and better manage cyber risk together.

Source: RecordedFuture
Source Link: https://www.recordedfuture.com/charting-new-terrain-shift-resilience-proximity-cyber-risk